How to Read Crypto Charts in 2025 Like a Pro
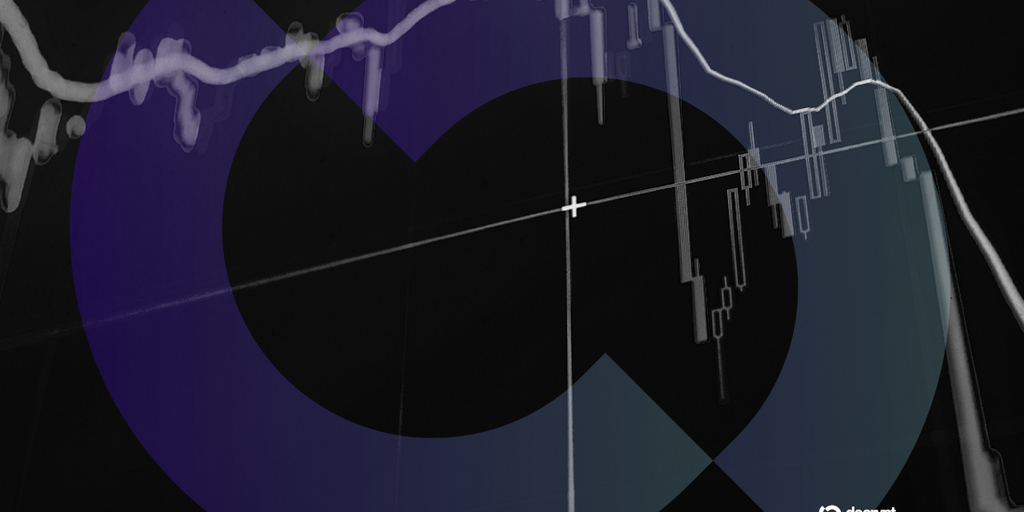
In 2025, the crypto market remains volatile due to shifting regulations, emerging technologies, and AI-driven trends. For beginners, understanding crypto charts is crucial for making sense of market fluctuations and developing trading strategies. Crypto price charts—based on open-high-low-close (OHLC) data—display price movements across different periods and are fundamental to technical analysis. The most common chart types include candlestick, bar, and line charts, with advanced versions integrating onchain data like wallet activity and total value locked (TVL). Key chart patterns to know are head-and-shoulders, double tops and bottoms, triangles, flags and pennants, and wedges. These patterns signal potential trend reversals or continuations and are shaped by collective market psychology. Many traders prefer logarithmic charts for a clearer view of percentage gains over time. Complementary tools such as volume indicators and trend-following metrics (e.g., RSI) help validate patterns and strengthen analysis. Effective risk management involves combining pattern analysis with indicators and news, risking only small capital amounts, and avoiding FOMO. Common mistakes include trading false breakouts without volume confirmation and overtrading. Backtesting strategies on historical data improves confidence and clarity. Trading in crypto always carries risk; users should research and apply disciplined methods.