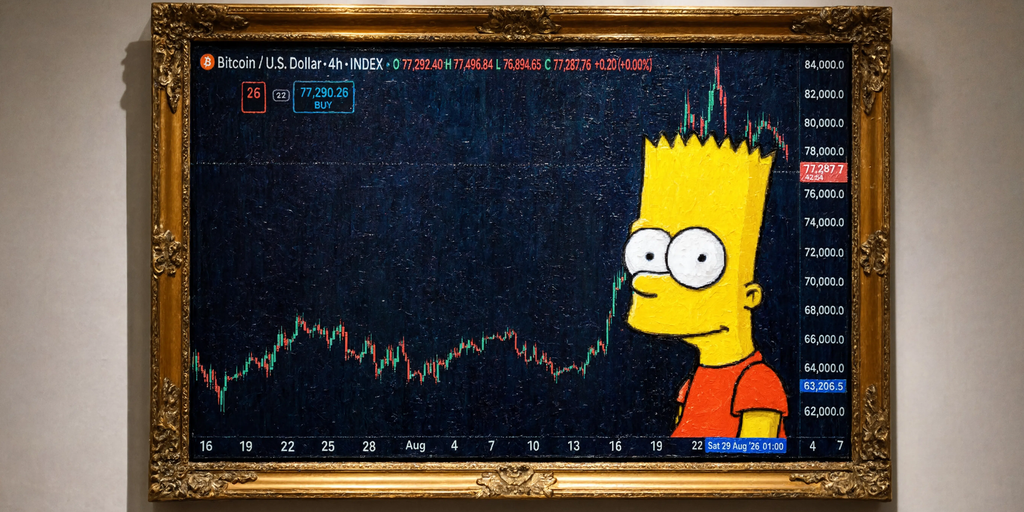
Is Bitcoin About to Flash Crash? What a 'Bart Simpson' Pattern Would Actually Take
Bitcoin surged nearly 25% in August, then stalled and slipped from about $80,700 to around $77,470. Traders are debating whether this price action forms a “Bart Simpson” pattern: a sharp rally, sideways chop, then a fast drop back toward the start. Current 4-hour indicators are mixed rather than decisive. RSI is 44.8, ADX is 22, the Squeeze Momentum indicator is bearish, and the 50-period EMA remains above the 200-period EMA, which still supports a broader bullish structure. A true flash-crash version would require a quick break below $75,800 and a liquidation-driven drop back toward $64,000. September adds pressure because it is Bitcoin’s weakest historical month, with a possible Fed rate hike, ETF outflows, and higher oil prices reinforcing risk-off sentiment. A slower bearish alternative is also possible: a multi-week decline toward the low $60,000s rather than an abrupt crash.